Student Dropout Analysis
An intelligent dashboard built for a state-level hackathon by the Government of Gujarat (2nd place winner) to help authorities analyze and predict student dropout trends. The system examines 17 dropout-contributing factors across 4 analytical categories, using official UDISE+ government education data to identify high-risk regions and underlying causes. Developed a Machine Learning-based prediction model trained on historical dropout patterns to forecast dropout rates for the next 5 years, enabling data-driven policy decisions through interactive dashboards and visual analytics.
Author: Prince Malani | Technologies: Machine Learning Models, Python, MySQL
Project Overview & Architecture
# Student Dropout Analysis
### Turning static UDISE+ education data into a forecasting-enabled decision platform
**SSIP 2022 · Gujarat State-Level Hackathon — 2nd Place**
Team of 6 · Role: ML Developer, Backend Developer & Database Designer
| | |
|---|---|
| **Backend** | Python · Flask · REST APIs |
| **Database** | SQL |
| **Data source** | UDISE+ dropout records, 2011–2022 · Excel ingestion for yearly updates |
| **Built for** | Gujarat State Education Department |
| **Owned** | Flask backend, SQL schema, ML pipeline, prediction model, Git workflow |
---
## Project Brief
Government education data tells you where dropout *has already happened*. It rarely tells you where it is *about to happen*.
Student Dropout Analysis closes that gap. It is an analytics platform for education administrators in Gujarat that turns a decade of historical UDISE+ dropout records into an interactive dashboard sliced across caste, age group, gender, and district, then layers a five-year forecasting pipeline on top of the same processed data.
The design constraint that shaped everything else: the system had to stay useful after the hackathon ended. Administrators upload each new year's dataset through the platform, the pipeline ingests and retrains on it, and an updated five-year projection is regenerated — without a developer touching the codebase.
I built the Flask backend end to end: authentication, the analytics API layer, dynamic multi-dimension filtering, SQL integration, and the full data-to-prediction pipeline.
---
## Problem Statement
UDISE+ publishes detailed dropout statistics for every state in India. The data is genuinely good. The problem is the form it arrives in: **static, pre-aggregated, backward-looking reports**.
For a state education department, that creates two distinct failures.
### 1. The analysis you need is the analysis a flat report can't do
Dropout is never explained by one variable. The useful questions are cross-cutting, and a fixed PDF report collapses exactly the intersections that matter — a district that looks average in aggregate can be hiding a severe gender gap in one age band.
| Dimension | Question it answers |
|---|---|
| **Caste** | Which social categories are disproportionately affected? |
| **Age group** | At which stage of schooling do students actually leave? |
| **Gender** | Where does the gap between male and female students widen? |
| **District** | Which regions carry the highest concentration of risk? |
The value isn't in any single dimension. It's in composing them — *female students, SC category, upper-primary age band, in these four districts* — which is a query, not a report.
### 2. Historical data cannot allocate next year's budget
An administrator deciding where to place intervention funding needs a forward view. UDISE+ gives none. Producing one meant taking raw 2011–2022 records through cleaning, feature selection, and model training to reach a projection defensible enough to inform a real allocation decision.
---
## Solution Architecture
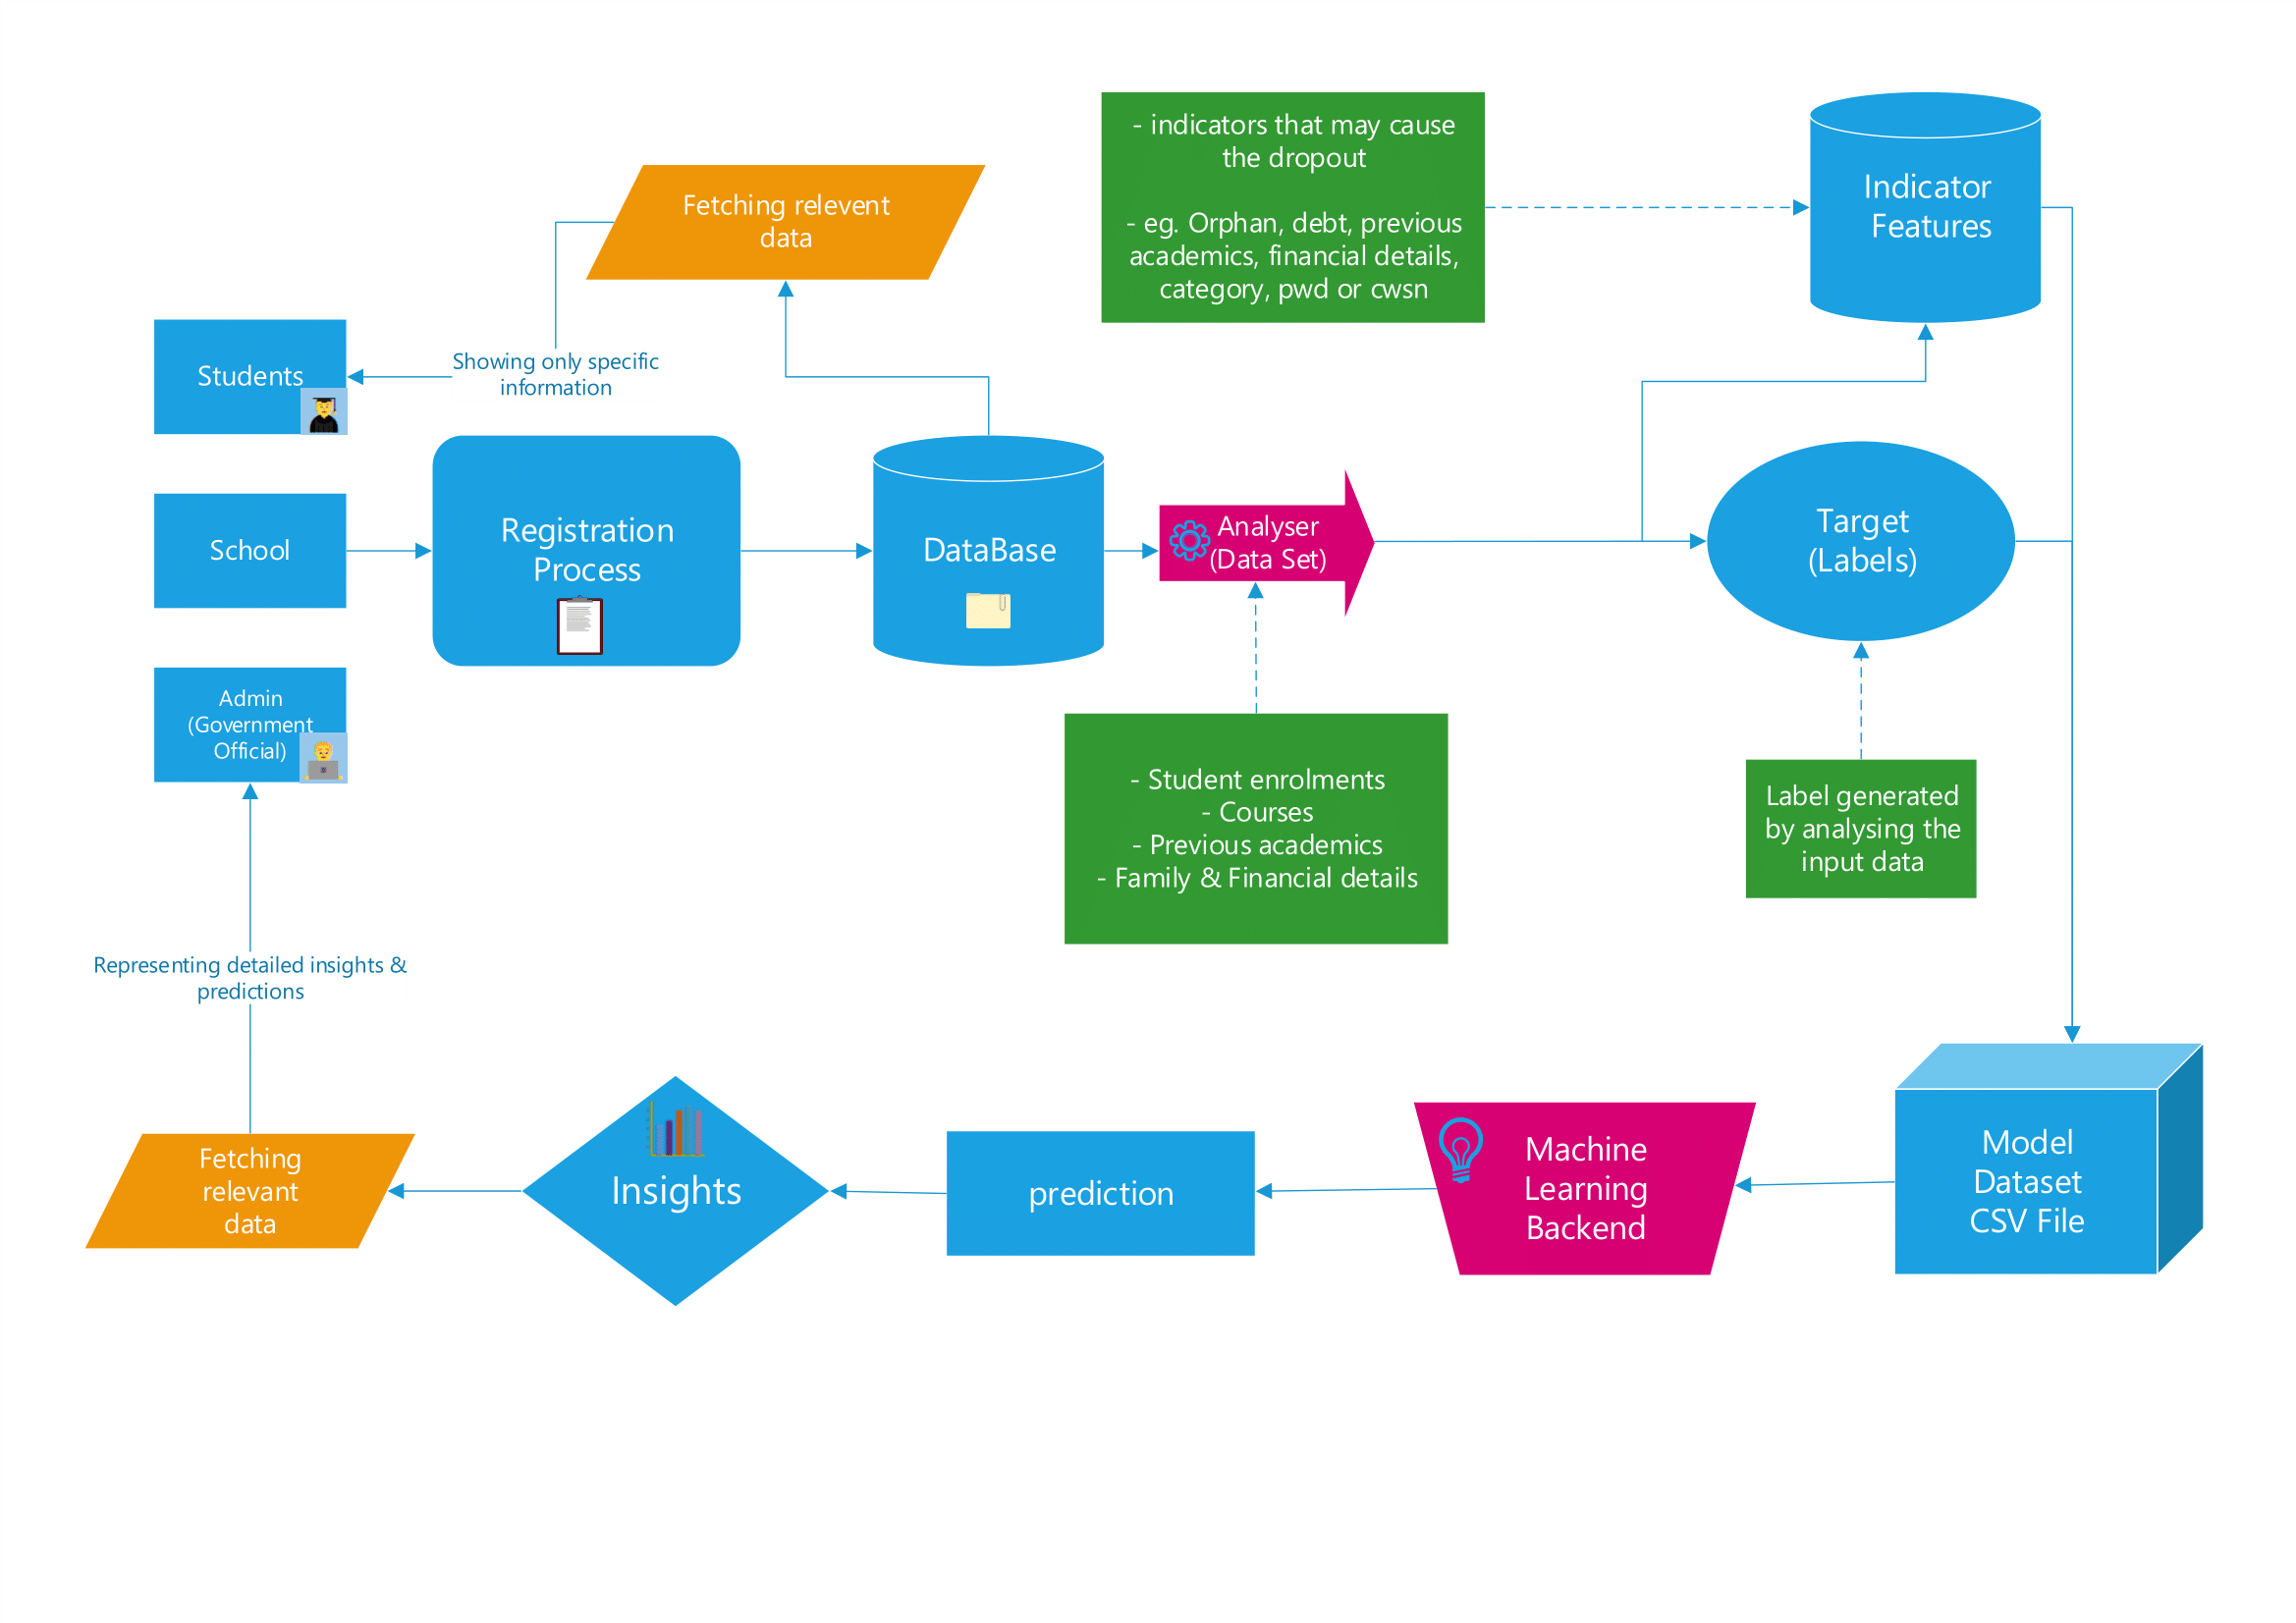
*System architecture — a single processed data layer feeding both the dashboard and the forecasting pipeline.*
### The core decision: one data layer, two consumers
The dashboard and the forecasting pipeline read from the **same processed data layer** rather than maintaining separate paths.
This was deliberate. The alternative — a dashboard querying the SQL store while the model trains from a separate exported dataset — is faster to build and quietly guarantees drift: the numbers an administrator sees on screen stop matching the numbers the projection was trained on. Sharing the layer means a newly uploaded dataset improves the historical view and the prediction in the same operation, and there is exactly one definition of the data.
### The second decision: ship a pipeline, not a model
The default hackathon outcome is a trained model artefact that is accurate on the day it is demoed and stale within a year. UDISE+ releases annually; a frozen model would have been obsolete before the department could act on it.
So the ingestion path became a first-class feature. An administrator uploads the latest yearly Excel file, the system validates and processes it, folds it into the training set, and regenerates the projection. The maintenance path is part of the product rather than a follow-up ticket.
**What administrators get:**
- Authenticated, role-secured access
- Centralised education statistics in a single view
- Category-wise dashboards across all four dimensions
- Dynamic filtering and free-form exploration rather than fixed reports
- Historical trend visualisation
- Five-year dropout forecasting
- Direct upload of new yearly data, with automatic pipeline retraining
### The Interface
#### Causes & Contributing Factors Analysis
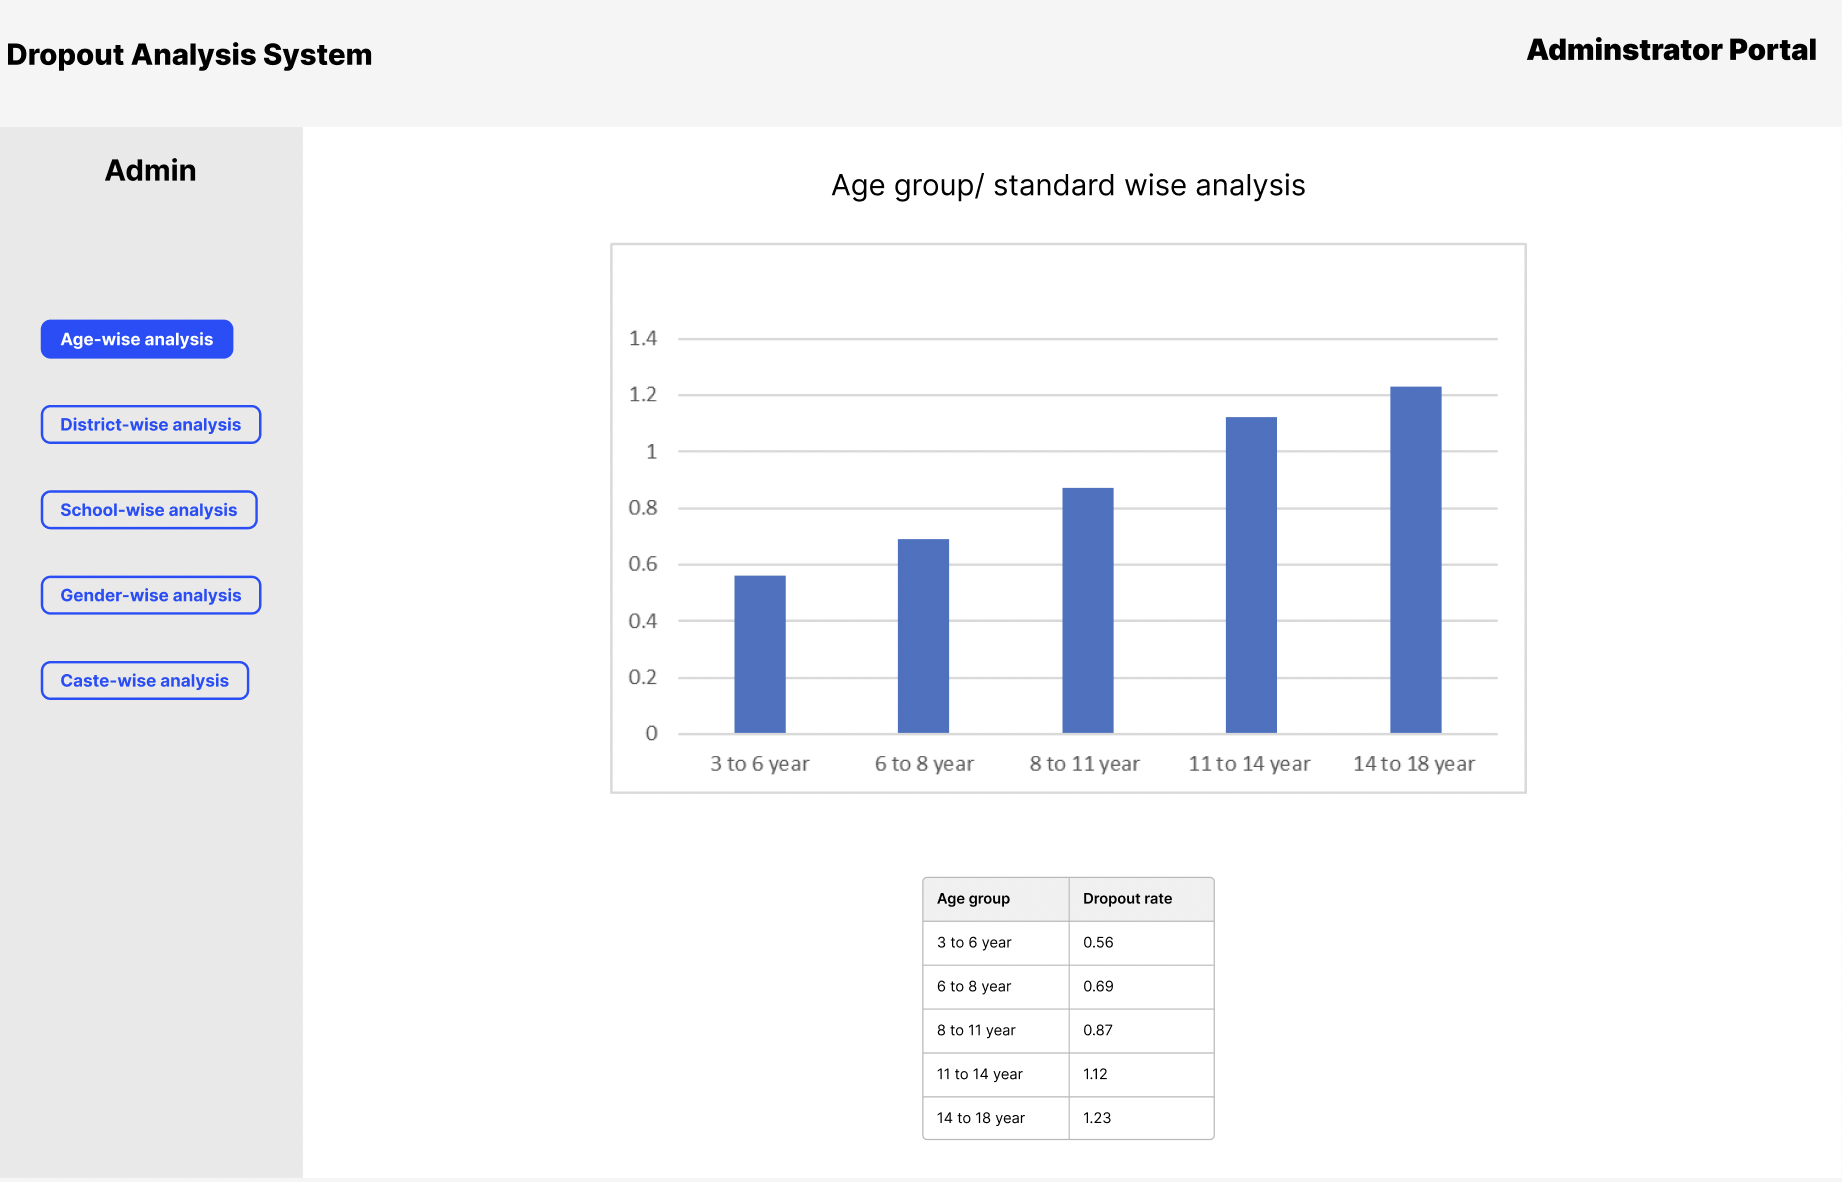
*Causes view — ranking contributing factors by magnitude. Family annual income dominates by a wide margin, followed by father occupation, minority group status, CWSN, and previous-year results. This view turns the dashboard from descriptive into directional, guiding administrators on where to intervene.*
#### District & Caste-wise Analytical Breakdown
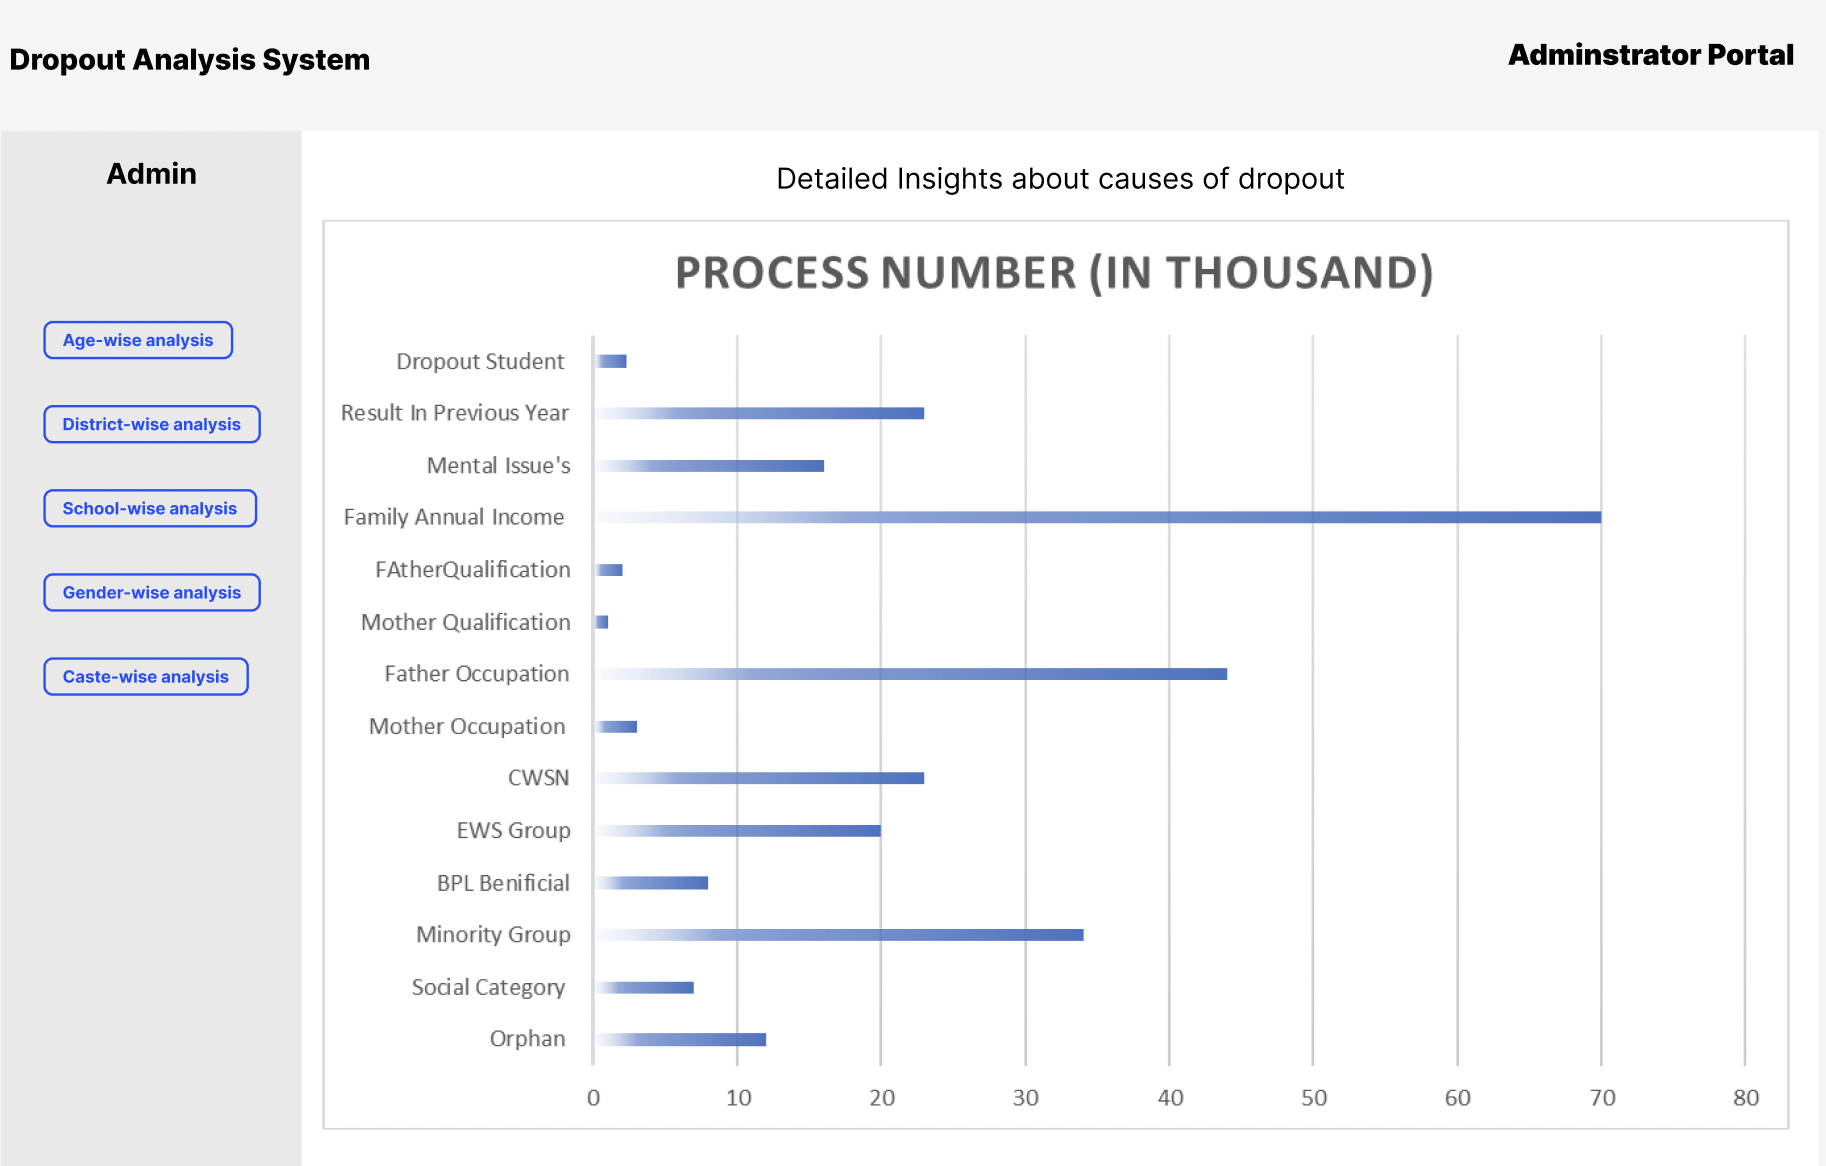
*District & Caste analysis view — displaying geographical and demographic dropout distributions across Gujarat districts. Helps administrators make data-driven resource allocation decisions by highlighting regional and category-specific dropout rates.*
---
## Technical Execution
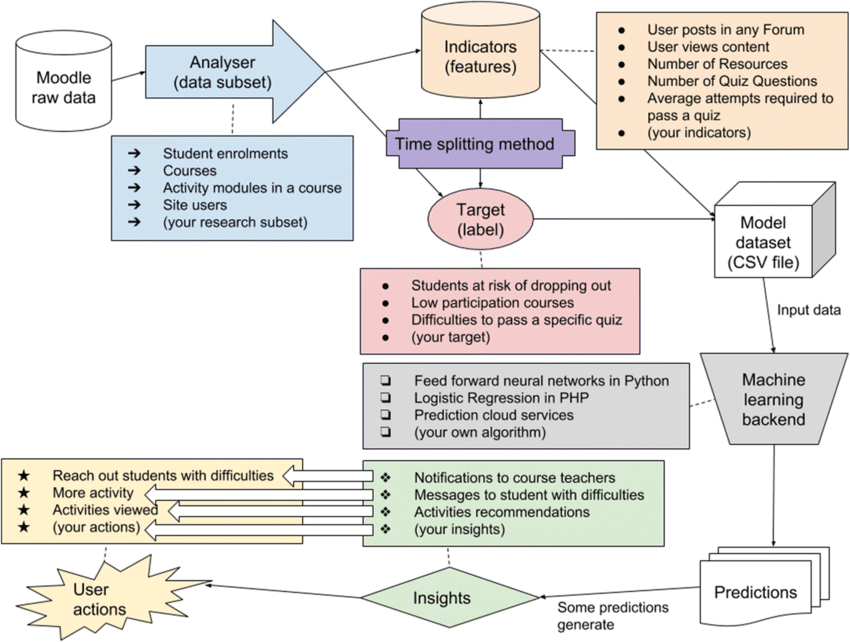
*End-to-end system flow, from raw UDISE+ ingestion through to rendered projections.*
### Backend & APIs
- Built the complete backend in **Python Flask**, including authentication and session handling.
- Designed the analytics API layer serving dashboard statistics and category-wise breakdowns.
- Implemented **dynamic multi-dimension filtering** across caste, age group, gender, and district, producing composable views rather than a fixed set of endpoints.
- Designed and integrated the **SQL schema** for querying a decade of education records across multiple dimensions.
- Optimised query and retrieval paths to keep dashboard interaction responsive when several filters are applied at once — the multi-filter case is the one users actually hit, and the one naive schemas handle worst.
### Data Pipeline & Modelling
- Processed and cleaned **eleven years of dropout data (2011–2022)**, resolving schema inconsistencies across release years and reconciling category definitions that shifted mid-series.
- Evaluated the full available field set and narrowed it to **~18 predictive features** aligned to the forecasting target, discarding fields that were administratively present but carried no signal. The retained set spans socioeconomic indicators (family annual income, BPL status, EWS group), household context (father's and mother's occupation and qualification), status flags (CWSN, orphan, minority group, social category), and academic history (previous-year result) — deliberately mixing economic, structural, and academic signal rather than leaning on any single class.
- Implemented and compared **Linear Regression and Multiple Linear Regression**, tuning each against the data profile to identify the better-performing setup.
- **Model selection was constrained by the data, not by ambition.** UDISE+ arrives pre-aggregated — there are no student-level records, and each district-category-gender series has roughly a decade of annual points. That rules out the high-capacity models people expect to see; with series that short, a regression that generalises beats a deep model that memorises. The honest framing is that linear regression was the right tool for the data available, not a fallback.
- Integrated the prediction pipeline **directly into the application**, so forecasts render in the same interface as the historical analysis rather than as an exported artefact.
### Git & Team Workflow
Owned branch strategy and merge discipline across a six-person team working in parallel on backend, model, and frontend — keeping the data layer contract stable while three workstreams moved against it.
---
## Results & Impact
- **2nd place at SSIP 2022**, Gujarat state-level hackathon.
- Converted static, backward-looking dropout statistics into an **interactive decision-support tool** for the state education department.
- Enabled four-dimension simultaneous analysis, surfacing district-level and demographic outliers that aggregate reporting structurally hides.
- Delivered **five-year projections** grounded in eleven years of real government data.
- Shipped a **self-sustaining data path** — projections stay current as new UDISE+ releases arrive, without developer intervention.
- Reduced dependence on manually compiled analytical reports for routine departmental questions.
The broader point the project made: **public education data already contains the signal. What's missing is the pipeline that makes it actionable.**
### Scope and limits
The forecast projects aggregate dropout trends; it does not identify individual at-risk students, and it should not be read as one that does. It also models correlation across demographic and geographic dimensions — it does not establish why dropout occurs in a given district, which remains a question for field investigation the platform can direct but not answer.
---
## Key Learnings
This was the first time I carried a data problem the full distance — raw historical records to a working product someone could make a decision with.
**A useful ML solution is mostly not the model.**
The prediction was perhaps a fifth of the work. The rest was data quality, feature selection, backend architecture, integration, and making the result navigable by a non-technical administrator. A well-tuned regression behind an unusable interface helps nobody, and that ratio has held on every applied project I've built since.
**Design for the next dataset, not the current one.**
The decision to build the retraining path was worth more than any accuracy gain I could have chased in the same time. It is the difference between a demo and a system, and it is almost always the thing hackathon projects skip.
**Let the data choose the model.**
Aggregated annual data with roughly eleven points per series does not support the model class that would have looked more impressive. Reaching for one anyway would have produced a worse forecast and a less honest deliverable.
### What I'd do differently
**Treat it as panel data explicitly.** The dataset is a classic panel — the same districts and categories observed repeatedly over time. Modelling it as independent regressions leaves the structure on the table; a panel or hierarchical specification would share strength across districts and produce better estimates for the small, sparse ones, which are precisely the districts an intervention budget cares about.
**Attach uncertainty to the projection.** The system outputs point forecasts. For a five-year horizon on short series, intervals matter more than the point estimate — an administrator needs to know which projections are confident and which are close to guesses. Delivering a single number invites more trust than the data can support.
**Validate against a held-out year from the start.** Establishing forecast error on a genuine holdout — training through 2019, testing on 2020–22 — would have made the accuracy claim concrete rather than qualitative, and would have been the single most credible number in the entire presentation.
---
### Skills built
Designing data systems for real government constraints · Production-oriented Flask APIs · Structuring and querying large analytical datasets in SQL · Historical data cleaning and feature selection from wide field sets · Regression comparison and tuning for time-based forecasting · Integrating ML pipelines into live web applications · Git workflow across a multi-stream team · Translating analytical requirements into an interface a non-technical stakeholder can navigate